
|
CBSE NCERT 8th Introduction of Graphs
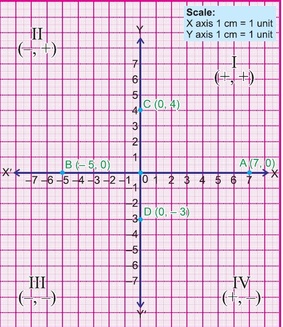
The mathematician who introduced graph was Rene Descartes, a French Mathematician in early 17th century. Coordinate axes: The position of a point in a plane is determined with reference to two fixed mutually perpendicular lines, called the coordinate axes. To mark a point, we always write the x-coordinate (or the number on the horizontal axis) first and then the y-coordinate (or the number on the vertical axis). The first number of the pair is called the x-coordinate or abscissa. The second number of the pair is called the y-coordinate or ordinate. Origin is the point of intersection of x-axis and y-axis. Let us consider the point P (4, 6). It is 4 units away from the right side of the y-axis and 6 units above the x-axis. Then the coordinate of the point P is (4, 6). Example Plot the following points on a graph paper and find out where do they lie? (i) A (7, 0) (ii) B (– 5, 0) (iii) C (0 , 4) (iv) D (0, – 3) Solution: Draw the x and y axes. Mark the units along the x and y axes with a suitable scale. (i) To plot the point A (7, 0) Here, the x-coordinate of A is 7 which is positive and the Y-coordinate of A is zero. Hence the point A (7, 0) lies on the x-axis. Start at the Origin. Move 7 units to the right along the x-axis and mark it. (ii) To plot the point B (–5 , 0) Here, the x-coordinate of B is –5 which is negative and the y-coordinate is zero. Hence the point B (–5 , 0) lies on the x-axis. Start at the Origin. Move 5 units to the left along the x-axis and mark it. (iii) To lot the point C (0 ,4) Here, the x-coordinate of C is zero and the y-coordinate of C is 4 which is positive. Hence the point C (0 , 4) lies on the y-axis. Start at the Origin. Move 4 units up along the y-axis and mark it. (iv) To plot the point D (0 , –3) Here the x-coordinate of D is zero and the y-coordinate of D is –3 which is negative. Hence the point D (0, – 3) lies on the y-axis. Start at the Origin. Move 3 units down along the y-axis and mark it. |
|
|
| ||||||
HTML Comment Box is loading comments...
